

Processing of the Raman spectrum images requires two calibration steps and the processing of the actual spectrum image.
The neon calibration converts pixel values to wavelengths, the polystyrene calibration allows the exact determination of the otherwise unobtainable laser wavelength. With the calibrations the raman spectrum image can be converted in a spectrogram with a wavenumber scale.
Simplified workflow for Raman Image Processing
..
The entire image processing workflow is implemented in an ImageJ plugin which combines the different modules in a menu structure. The Raman plugins are fully integrated into a modified version of ImageJ:
......
Calibration: Neon
The first step in the image processing workflow is the calibration of the spectrum with Neon lines derived from a low pressure neon glow lamp with a small amount of argon. This procedure allows to assign a wavelength to each pixel of the spectrum image. The procedure requires an image named Calibration.tif or Calibration.fit to be open. If a darkframe image is also open, the darkframe image is subtracted from the calibration image. From the resulting image the bright outliers are removed. The region of interest (position of the spectrum) is cut out and binned by average. The defined windows for the calibration line positions are read into arrays and are fitted with a Gaussian curve. The peak maximum positions of the Gauss curves are extracted and fitted with a cubic (POLY2) fit. If the R^2 of the fit is less than 0.99, a warning is issued by the system. The three parameters of the cubic curve are written into the ImageJ preference file. The initial values for region of interest, the peak wavelengths and the window data are read from the preference file at the start of the procedure and written into it when the run button is pressed. The calibration module depends on the grating used (600 or 1200 l/mm).
............
Calibration: Polystyrene
The second step in the image processing workflow is wavenumber calibration or in other words the determination of the exact laser wavelength. The standard used is a polystyrene plate with a wavenumber of the main peak at 1001.4 1/cm. The procedure and data is described in: ASTM E1840-96R02 - Standard Guide for Raman Shift Standards for Spectrometer Calibration. The procedure requires an image named Polystyrene.tif or Polystyrene.fit to be open. If a darkframe image is also open, the darkframe image is subtracted from the polystyrene spectrum image. From the resulting image the bright outliers are removed. The region of interest (position of the spectrum) is cut out and binned by average. The region 1500-2000 pixel is used to calculate intensity vs wavenumber based on the laser wavelength stored in the preference file. With the data a Gaussian fit is performed. The found position of peak max is subtracted by 1001.4, based on the difference the new laser wavelength is calculated and stored in the preference file.
Image processing
The spectrum image processing procedure converts the spectrum image into a calibrated spectrogram which is saved as a text file.
The procedure requires an image named Spectrum.tif or Spectrum.fit to be open. If a darkframe image is also open, the darkframe image is subtracted from the calibration image. From the resulting image the bright outliers are removed. The region of interest (position of the spectrum) is cut out and binned by average. After binning four different processing options are available:
Minimum: no further processing of the image
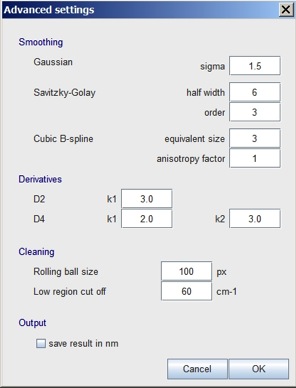
Standard: the image can be smoothed by Gaussian blur, Savitzky-Golay or Cubic-Spline. The smoothing parameters are accessable through the advanced settings dialogue.
Derivative D2: Derivative D2 allows derivative resolution enhancement. After smoothing the second derivative is calculated, weighted and subtracted from the original image: R = Y - k2Y’’. The smoothing parameters and the weighting factor k2 are accessable through the advanced settings dialogue.
Predictive D4: Predictive D4 allows extreme resolution enhancement for experimental purposes. After smoothing the second and fourth derivatives are calculated, weighted and subtracted (2nd) or added (4th) from the original image according to: R = Y - k2Y’’ + k4Y’’’’. The smoothing parameters and weighting factors k2 and k4 are accessable through the advanced settings dialogue.
Finally the background is removed with the rolling ball algorithm. The resulting image is then converted into a textfile while applying the calibration data.
The different methods can be chosen from a starting window:
............
The last update of the plugin allows to save the result file either tab separated as text file or in ruff format with the correspondent file header. For smoothing one of three different methods can be selected now.
............
By checking the advanced settings box the main parameters can be altered if needed at all. It also allows to calibrate spectra for wavelength in case other than raman spectra are processed.
............
The calibration data is imported from the calibration plugin or can be entered by the operator. After the calibration to wavenumbers is done, the result is saved in a tab separated text file. This format can then be opened in CrystalSleuth and searched against the database. Additionally a log file can be displayed and saved containing laser data (accurate wavelength, wavenumber), fitting parameters and the image processing parameters. This file can be saved together with the raw data.
For CrystalSleuth see http://rruff.info/about/about_software.php