Please note that the images here are only for demonstration, they are not made for actual measurements. Additionally, resizing and compressing them for the webpage degraded them slightly.
Spectral imaging
Restricting the illuminating light to a smaller range (typically a FWHM of 10 nm) can already add helpful informations to the resulting image. Unknown minerals can be compared with known ones in the same sample if the reflectances at the used wavelength are known. The procedure is simple: first a bandpass filter is inserted into the light path of the ore microscope. Then an image is taken without or with only the polarizer in place and is finally flat-field corrected. Preferably a monochrome-camera is used to avoid interference by the Bayer-mask which can be quite severe at shorter wavelengths.
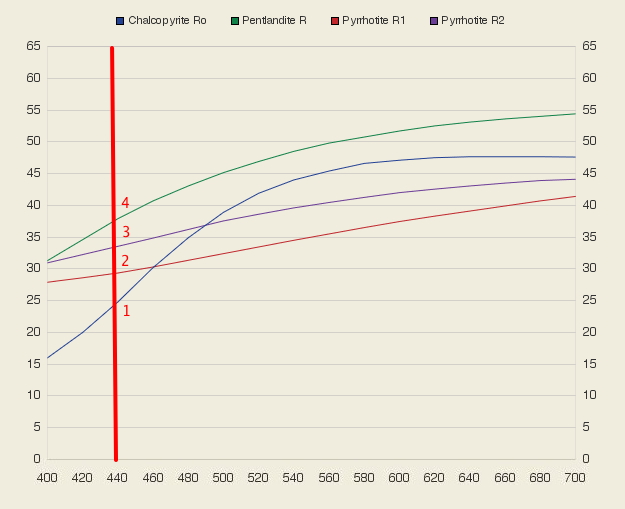
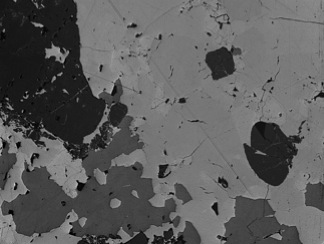
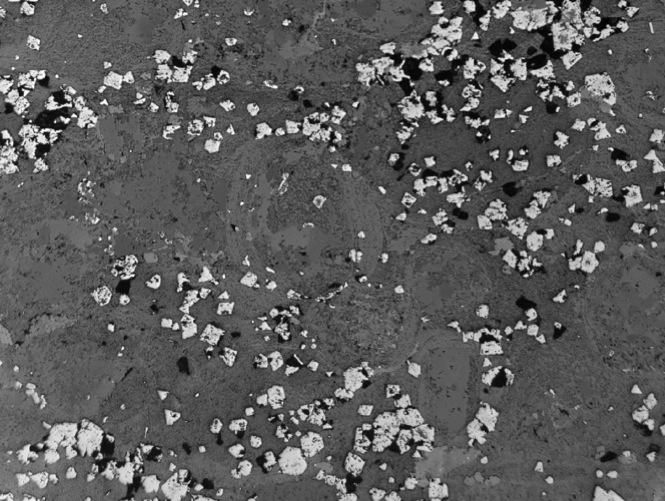
Here is just a simple example with known minerals: this ore is a mixture of pyrrhotite, pentlandite and chalcopyrite. The picture was taken at 440 nm and it is easy to sort the minerals by grey values and correlate them with the reflectance curves. Note that 2 and 3 might not exactly be the R1 and R2 positions.
__

__
Multispectral imaging
In ore microscopy multispectral imaging can help in mineral identification as well as in mineral classification. Multispectral imaging is in a certain way the extension of photospectrometry with the difference, that spectrometry is done on one small area of the sample, while in multispectral imaging spectra can theoretically be generated for every pixel of the image. Multispectral imaging is performed the same way as spectral imaging but on several wavelengths. The same procedure is applied to a reflectance standard. From each pixel of the image from the ore sample the reflectance can be calculated for every wavelength used. For more details this very good article is recommended: Pirard E.: Multispectral imaging of ore minerals in optical microscopy. Mineralogical Magazine 68 (2004) 323-333.
The next four fotos are showing the sample from the example above at 400 nm, 440 nm, 480 nm and 520 nm, respectively.


Even if the reflectance at a narrow wavelength range is not measured in absolute values here, the the relation to the reflectance curves is clearly visible, especially at the intersections of the curves. (Data from Criddle/Stanley: Quantitative Data File for Ore Minerals, Chapman & Hall, 1993). An extract for the four fotos above is shown in the next picture:
__

Optical mineral classification
While (multi)spectral imaging helps in mineral identification, classification can add quantitative informations about the mineral content. Image classification groups pixels by their properties into several classes which in the case of ore microscopy represent the different minerals. Image classification is a well known technique in remote sensing and geospatial imaging. A variety of algorithms for classification and software suite are available on the market. Spectral and multispectral imaging supports the classification process by providing images at wavelengths where the minerals have the maximum difference in reflectance. Quantification by mineral classification is of course limited by the form of the classified minerals as the output is area % and gives no information about the volume.
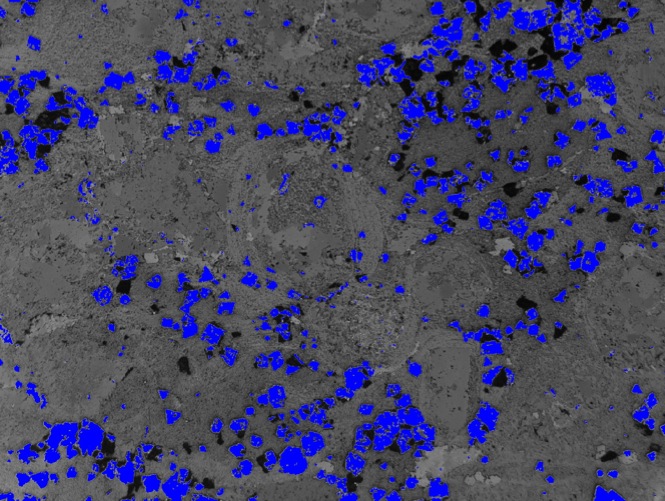
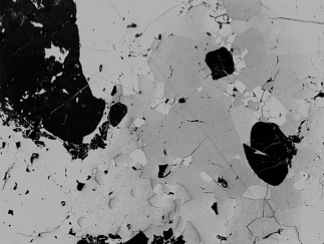
Short example: an ore contains scattered euhedral magnetite crystals. Classification is easy in this case, because the difference in reflectance between the magnetite and the non-opaque minerals is high. Classification resulted in an area of 11.7% for magnetite which fits the whole ore analyses published in literature, see also the Chamoson page.
Original image:
Classification image:

Overlay of the original image with class blue: